Flurry Analytics Reveals Where We Spend Most Time On Mobile Devices
With more then a billion users using mobile devices and applications – the result of the past five years of mobile computing – Flurry comes to share some interesting thoughts about how they see US consumers using mobile devices.

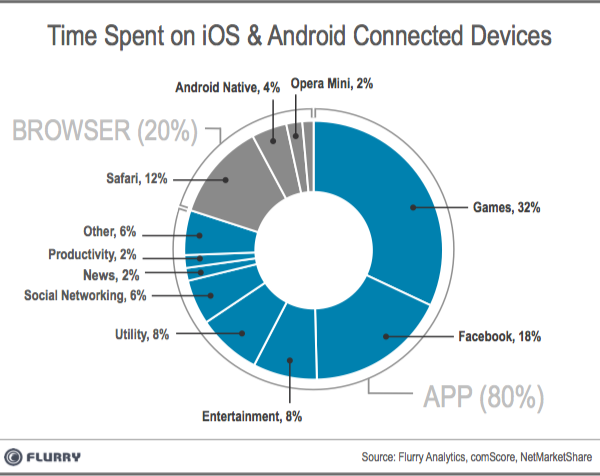
Turns out they spend an average 2 hours and 38 minutes each day on mobile devices (smartphones and tablets), with gaming accounting for 32% of that time, seconded by Facebook with 18%. Safari ranked third, with 12%, although mobile web browsers combined account for 20% of the time spent on mobile devices.
With the growth of the App Store (which now has more than 800,000 apps), along with Google Play, the number of apps launched per day has slowly grown from 7.2 in 2010 to 7.9 in 2012, with the steady growth rate suggesting the app economy is not yet experiencing saturation. WSJ analysts have projected that the market will reach the $25 billion milestone this year.

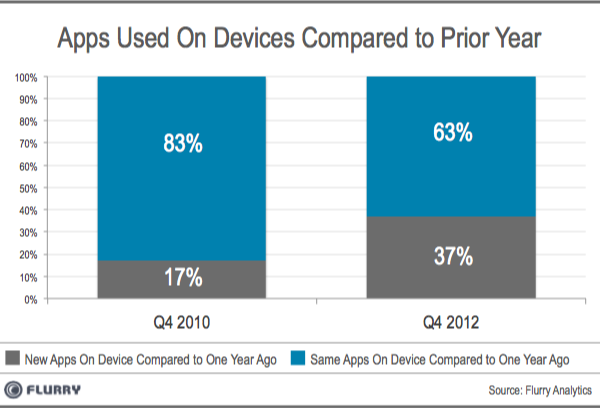
With so many apps available, Flurry has found that 63% of the apps used in Q4 2012 were new and most likely not developed in 2011. This suggests a trend among consumers to try out new apps, implying the app market is still in early stages and there is plenty of room for innovation as well as breakthrough new apps.
Flurry concludes that what was once perceived as Facebook’s Achilles’ heel has become its biggest opportunity: mobile. US consumers spend an average 30 minutes per day using the Facebook app.

