Flurry Report: iOS Leads Android Over User Engagement
The mobile market has been dominated over the past four years by two mobile OS giants: Android and iOS. Google’s Android is definitely the No. 1 mobile OS globally, but more recently many analysts have started to question the value of Android, specifically focusing on the high-end smartphone and tablet market. Flurry has decided to take a deeper look into the leaders’ market share.
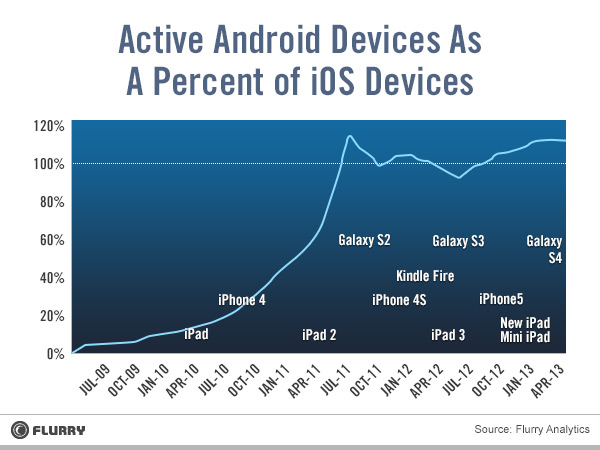
The findings may or may not surprise you: Android falls short in terms of total time spent in apps, despite that there are 120% more active Android devices than iOS devices.
Analyzing the total time in apps on Android devices as a percent of total time spent in apps on iOS devices, the Flurry stats show that Android devices hardly reach 80%. Also, as you can see from the chart below, the exact proportion of time spent in apps per Android device relative to iOS devices is close to 60% as of April 2013.
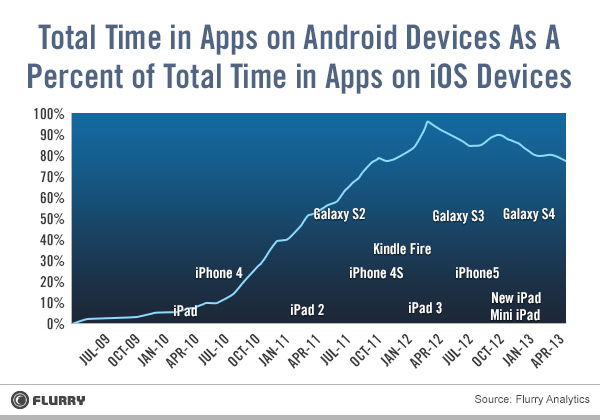
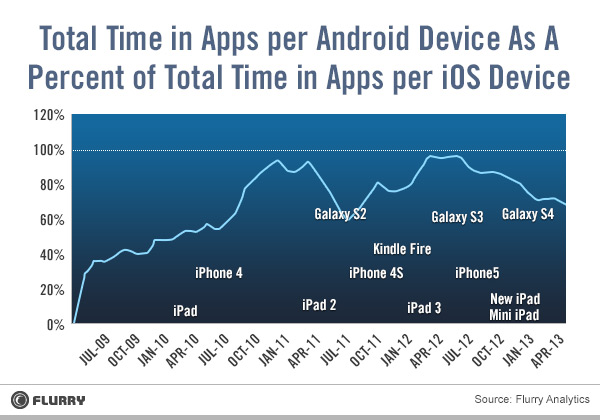
Why doesn’t app usage share follow device shares? Flurry has a few explanations: it could be due to different types of users, or due to Android market fragmentation that prohibits users from accessing content. A third explanation is related to the previous ones: the larger and richer ecosystem of apps that exists in iOS feeds on itself. In the end, the clear winner is Apple, due to its supremacy in profits and developer attention.

