Uber Canada Expands Services to Newfoundland and Labrador
Uber Canada has expanded its ridesharing services to the entire Avalon Peninsula area within Newfoundland and Labrador.
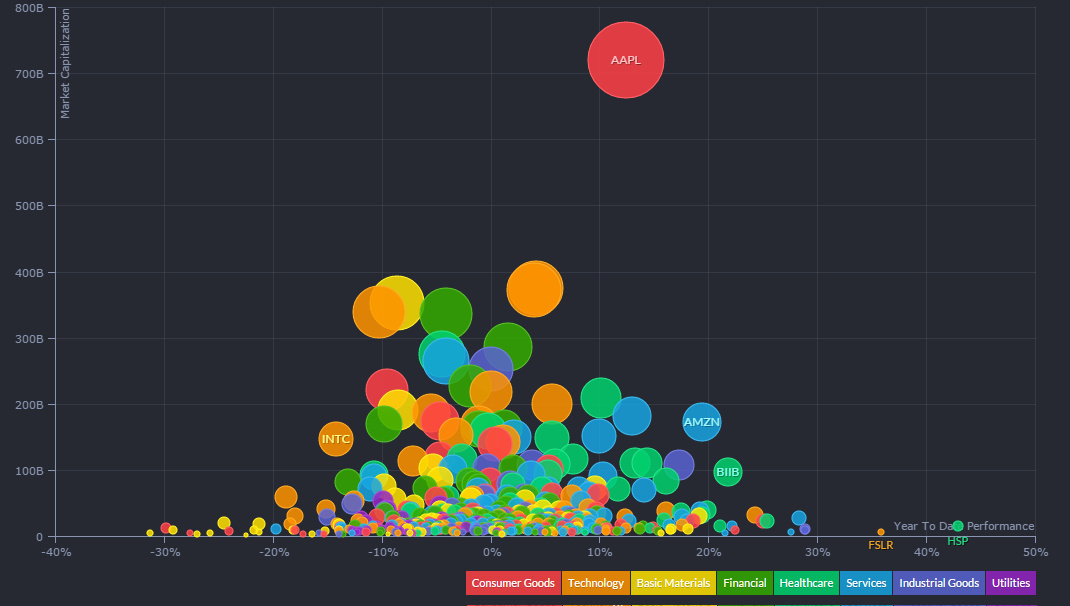
Back in 2012, Apple’s stock (AAPL) made the Cupertino company’s market value break Microsoft’s old record of $616.3 billion market capitalization set in 1999, while more recently, it became the first stock to ever trade above $700 billion market cap. Keeping in view this record setting market capitalization, Visual Capitalist has come up with a graphic that visualizes the stark contrast between AAPL and all other S&P 500 mainstays.

The horizontal axis in the graphic shows the YTD performance of S&P 500 stocks coloured by sector, and the vertical axis shows market cap.
It is believed that if the Apple Watch can truly disrupt the watch market, it could be a key driver in bringing AAPL to a one trillion dollar market cap.