iOS and Mobile Safari Lead the Way in Canada and the U.S. According to Statcounter
The latest mobile data charts from Statcounter reveals Apple’s iOS and mobile Safari continue to dominate the mobile landscape in Canada and the U.S, but competitors such as Android aren’t far behind and have made it a close race.
Statcounter receives their data from the more than 3 million sites that use their tracking code. Here’s how they explain they track visitors:
StatCounter is a web analytics service. As of 1 June 2010, our tracking code is installed on more than 3 million sites globally. (These sites cover various activities and geographic locations.) Every month, we record billions of hits to these sites. For each hit, we analyse the browser/operating system used and we establish if the hit is from a mobile device. For our search engine stats, we analyze every hit referred by a search engine. For our social media stats, we analyze every hit referred by a social media site. We summarize all this data and this is how we get our Global Stats information.
We do not manipulate the data in any way. We do not collate it with any other information sources. No artificial weightings are used. We simply publish the data as we record it.
In other words we calculate our Global Stats on the basis of more than 15 billion hits per month, by people from all over the world onto our 3 million+ member sites.
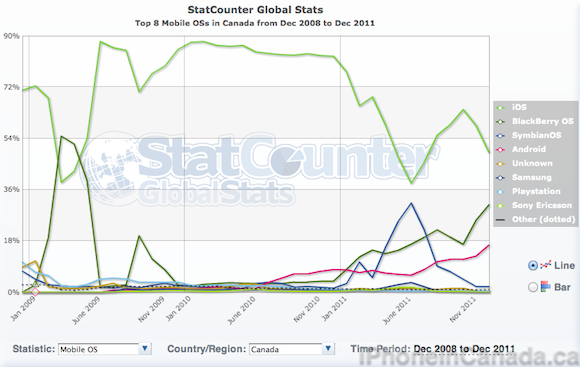
Taking a look at data from December 2008 to December 2011, Here are the charts for the mobile landscape in Canada in terms of mobile operating systems and browsers. Canada’s sample size of hits as of May 2010 was 477 million.
The line chart below shows how popular iOS is Canada (the iPhone 4 was noted by comScore to be the most popular cellphone in Canada), along with Blackberry OS. Android remains a distant third:
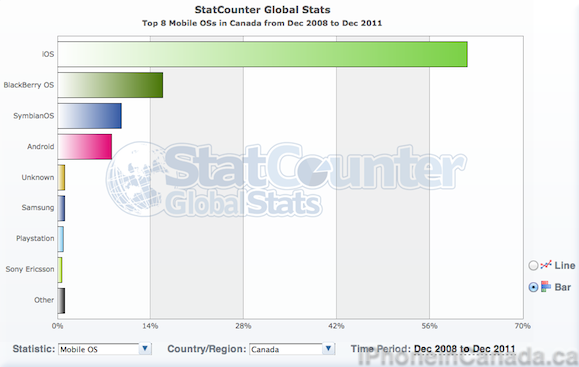
Here’s is the bar graph for the exact same data:
- iOS: 61.5%
- Blackberry OS: 15.85%
- SymbianOS: 9.61%
- Android: 8.18%
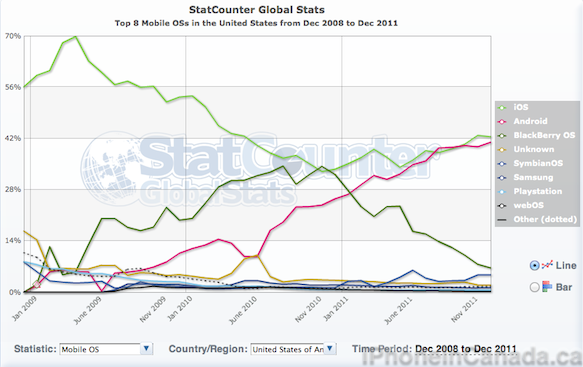
Here are similar images for the U.S, which according to Statcounter has the largest sample size of hits at 4 billion. Here is the Mobile OS line chart. You can see iOS and Android are in a tight race, with the latter eclipsing iOS slightly in the late summer. Blackberry OS has made a nosedive due to disappointing and embarrassing products (Torch, PlayBook, etc):
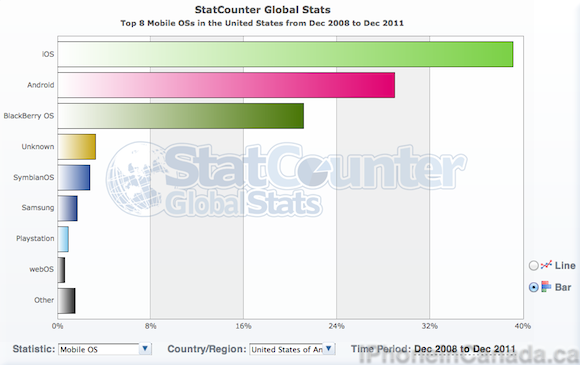
Here’s the same data in a bar graph:
- iOS: 39.11%
- Android: 28.93%
- Blackberry OS: 21.15%
Now, what does all this data mean, exactly? Note that Statcounter only measures the devices being used in a particular country based on hits to their 3 million+ sites running their analytics code. There is no link to carrier sales numbers so these charts just show what phones are being used based on data they have received. Still, it’s just another interesting point of view on analyzing the smartphone landscape.
[via MobileSyrup]
